Period (continued)
The following is an example that shows what happens to the graph of a trigonometric function when you change the period.
Graph f(x) = cos(2x). Find the period. Now graph f(x) = cos(x). Compare the graphs and notice how changing the period affects the graph of f(x) = cos(x).
Remember: for the equation y = cos kx, the period is defined as  .
.
In this example, k = 2 so the period is  .
.
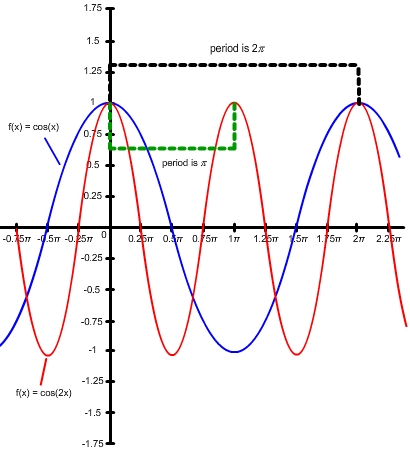
Notice what happened to the graph when the period was changed (black dashed line vs. green dashed line). The graph of f(x) = cos(2x) goes through 2 cycles over the domain of 2 radians whereas the graph of f(x) = cos(x) only goes through 1 cycle over the same domain.