Amplitude, Period, and Phase Shift
Work through the following examples to see how you can put the amplitude, period, and phase shift together on one graph.
Example 1:
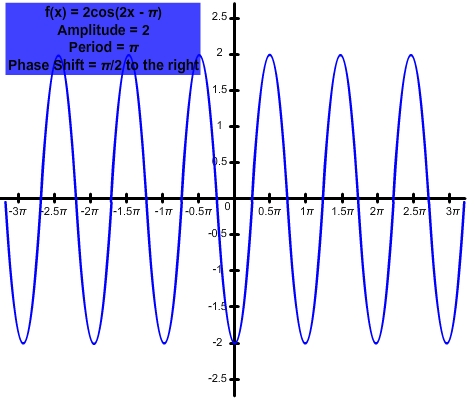
Graph  . What is the amplitude, period, and phase shift of this function?
Phase Shift =  , c > 0 so the graph shifts to the right.
To look closely at how this is graphed, break down this function’s equation, step by step.
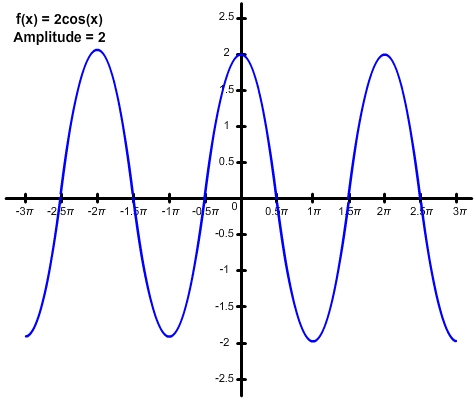
First, graph f(x) = 2cos(x):
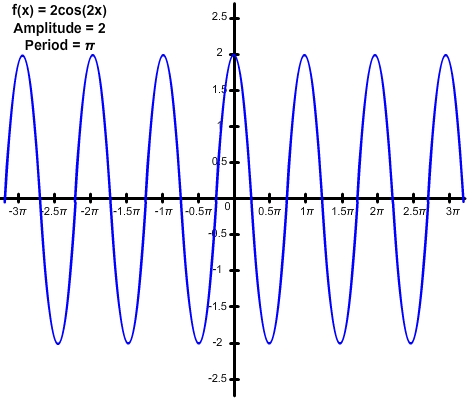
Next, graph f(x) = 2cos(2x):
Now you can graph f(x) = 2cos(2x -  ):
):