Tangent Function (continued)
If you graphed the data from the table, the tangent function would look like the following:
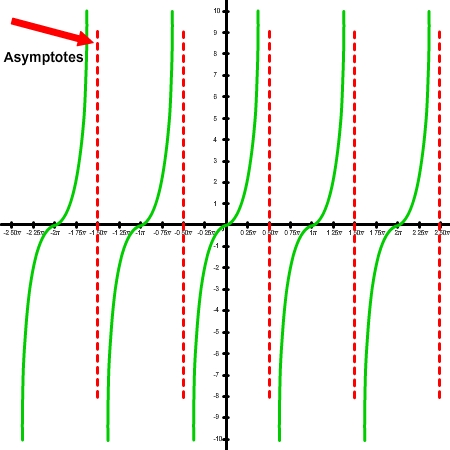
What are the asymptotes that are marked in the drawing?
A vertical asymptote of a function is a line, x = a , where f(x) approaches infinity,  , or negative infinity,
  , as x approaches a from either the left or the right. The asymptote corresponds to the zeros in the denominator for a function. The graph will approach the asymptote but will never intersect it. In the case of the tangent function, the graph approaches the asymptotes shown in red, but it will never intersect the line. This is what makes it undefined.
The mathematical notation for “approaches” is  .
.
A horizontal asymptote of a function is a line, y = b , where  as
as  or
or  .
.